
I’ve been frustrated over the past couple of months at the failure of housing in general and mutli-family housing in particular to respond to market in forces in the way I predicted late last year.
Part of the issue, however, seems to have been that the data was simply behind the curve. Sharp upward revisions to the past few months put us closer to the track I had expected and if by chance similar revisions come in with the next two months data we will be on track.
Total housing starts were at 717 thousand (SAAR) in April, up 2.6% from the revised March rate of 699 thousand (SAAR). Note that March was revised up sharply from 654 thousand.
Single-family starts increased 2.3% to 492 thousand in April. March was revised up to 481 thousand from 462 thousand.

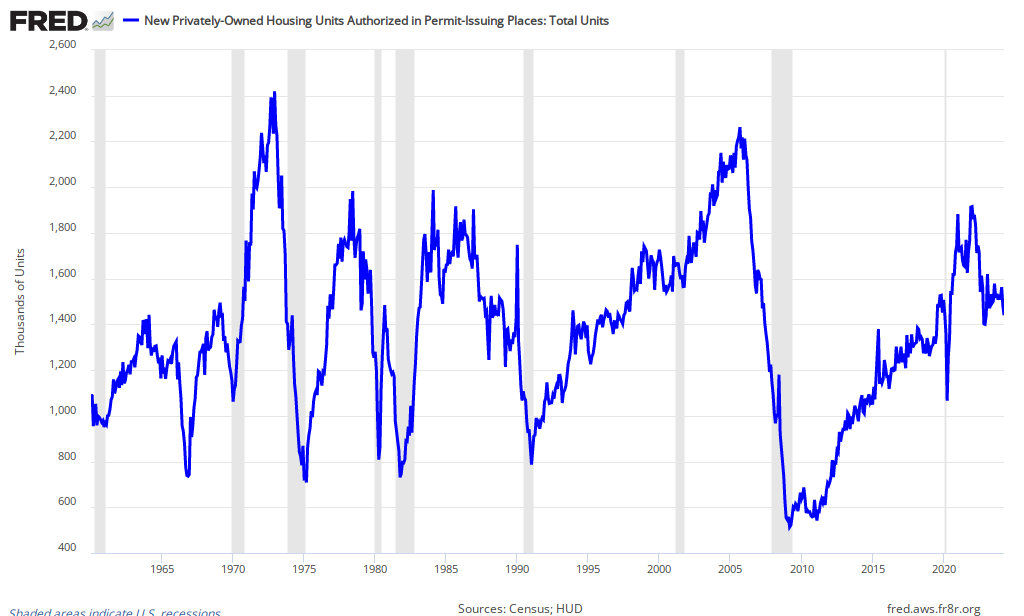
Also, though the permits data was revised up was well it has been much more consistent and shows something closer to the parabolic path I had been expecting.

5 comments
Comments feed for this article
Wednesday ~ May 16th, 2012 at 8:57 am
curtd59
You’re the best at the data we have Karl.
Wednesday ~ May 16th, 2012 at 9:28 am
anoncubed
Why is the substantial rise in housing (particularly multi-family) starts not showing up in the residential construction series and construction employment series?
Wednesday ~ May 16th, 2012 at 10:11 am
Checking in on the Rental Boom, Cont’d.
[…] Karl Smith posts a chart of building permits, and comments I’ve been frustrated over the past couple of months at housing in general and mutli-family housing in particular to respond to market in forces in the way I predicted late last year. […]
Sunday ~ May 20th, 2012 at 4:38 am
Weighing the Week Ahead: Any Help from the European Summit? | Investing Advisers
[…] builder confidence was also stronger. See Calculated Risk for a full chart pack on housing and Karl Smith at Modeled Behavior for ideas about the data revisions are finally catching up with actual growth. CR also notes The […]
Sunday ~ May 20th, 2012 at 11:22 pm
Indicator Update: European Summit Edition
[…] builder confidence was also stronger. See Calculated Risk for a full chart pack on housing and Karl Smith at Modeled Behavior for ideas about the data revisions are finally catching up with actual growth. CR also notes The […]